

One of the areas I struggle with in trading is technical analysis, particularly interpreting candlestick patterns to predict market movements. Whenever I’ve faced losses, people have often pointed out that these events were “obvious” when viewed from a technical analysis perspective.
This realization pushed me to improve my trading approach.
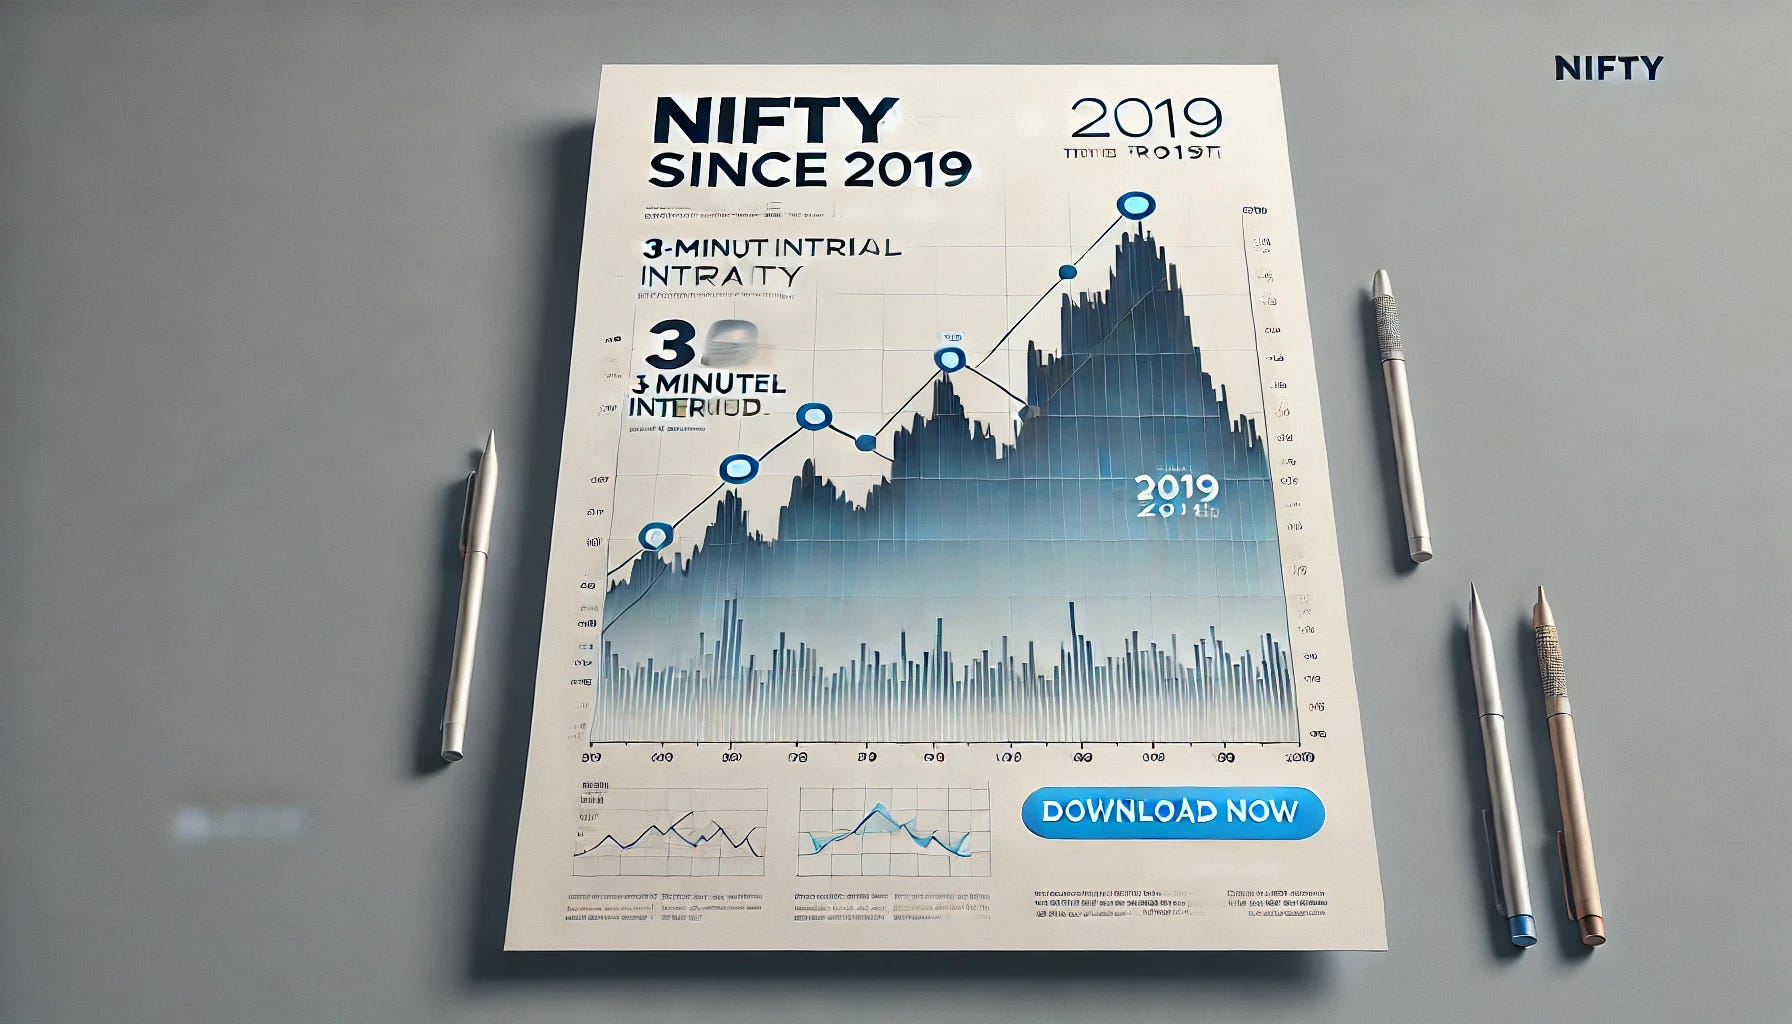
To address my gap in technical analysis, I decided to create a pattern-matching tool. The goal is simple: when I provide 3-minute closing values, the tool identifies similar patterns from the past 5 years. I usually run this analysis around 12:30 PM, as there are sufficient data points by then for meaningful comparisons.
If you're interested in staying updated on my work, follow me on X for regular insights and updates:
Note - The pattern matching analysis is still very preliminary, I will share the whole thing along with code once it is complete and I have more insights from it.
Data Collection and Setup
To implement this pattern-matching tool, I needed accurate NIFTY data. Thankfully, I was able to extract this data using KITE Connect’s historical APIs. Writing the code and fetching the data took less than two hours, thanks to the excellent APIs developed by the Zerodha team.
Sharing the Data
I believe this data can benefit many traders, so I’m sharing it here in two formats:
3-Minute Candlestick Data (OHLC)
File size: 10 MB
Format: Each row represents a 3-minute candlestick with OHLC data.
Daily 3-Minute Closing Price Data
File size: 1.6 MB
Format: Each row includes daily data with 3-minute closing prices in CSV format.
I hope this data is helpful to people to improve their trading.
This might help https://github.com/polakowo/vectorbt/tree/master/apps/candlestick-patterns
Thank you for this, great help!!!!!!